📙 You will learn
About the various available reports and statistics provided by ThreadFix.
Prerequisites
Audience: IT Professional or End User
Difficulty: Basic
Time needed: Approximately 5 minutes
Tools required: N/A
Introduction
Reporting in ThreadFix provides the ability to view application vulnerability data from many different angles. There are several different report types, each with its own filter set. These filters include limiting the view of data by date range, merged vulnerabilities, and various other metrics that allow users to control the visualization of application vulnerability data. Reports can be exported in various formats, such as PDF, CSV and SSVL. This allows for easy sharing of vulnerability data amongst teams and stakeholders. The following is a breakdown of each report and the data it displays.
Trending Report
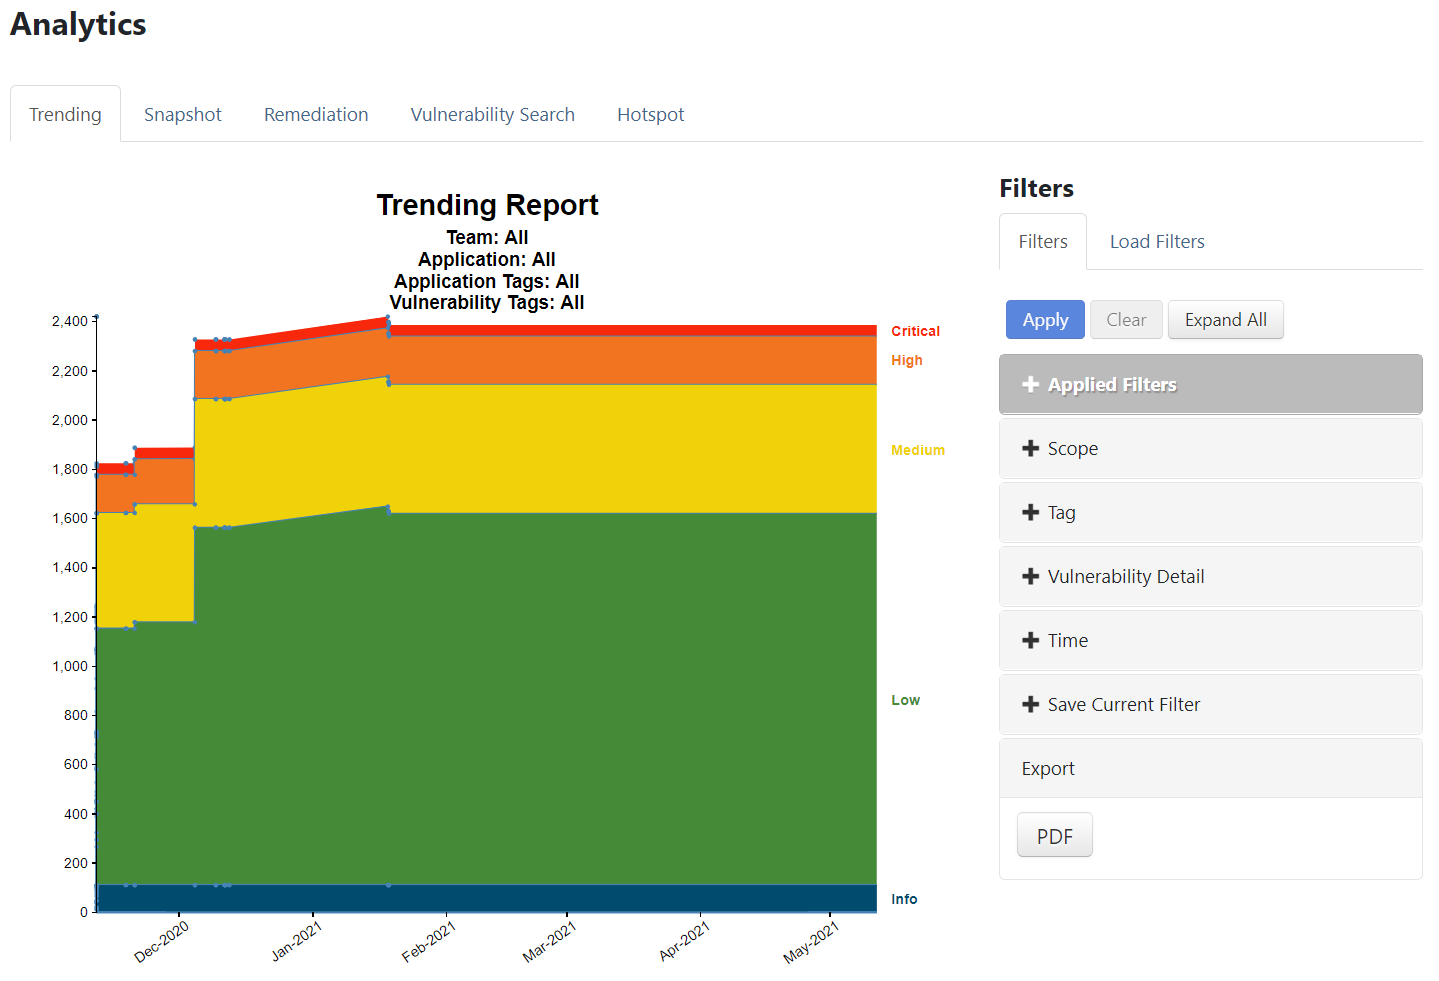
The Trending Report gives an excellent visual representation of how the number and composition of vulnerabilities for an application changes over time. Filters can be used to narrow the focus to a specific application, or leave the default settings and get a general overview of how teams are progressing.
Users can filter this report by Teams, Applications, Application Tags, Severity, Analysis Type, Aging, and Date Range. ThreadFix can export this report as a PDF.
Applied Filters
ThreadFix offers users the ability to apply various filtering options for reports. The Filters tab contains a series of pivots containing input fields or selectable checkboxes that can be combined to create a desired filter to run a report against. Created filters can be also be saved/loaded.
The example below demonstrates a basic report detailing a total count of Critical and High vulnerabilities for a single team and single application over a selected time range of Forever. Note the Applied Filters displayed field showing a summary of the applied filter settings.
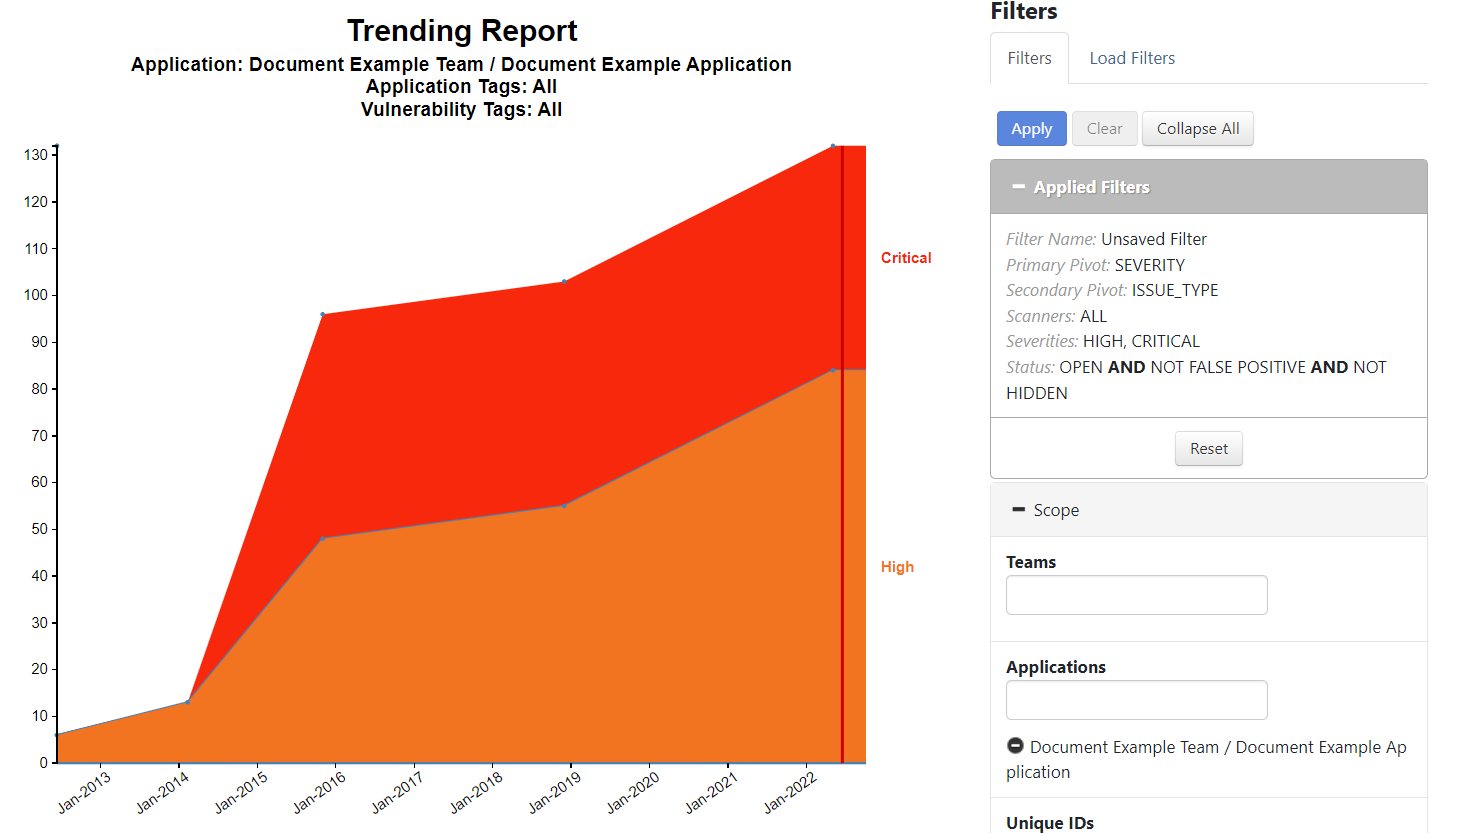
The graph also contains data points that when hover over display vulnerability counts on certain dates. These points are based on Vulnerability Open Dates derived from scan dates.

Filtering Details
Scope
Teams - Input field that allows users to include any desired teams into the report
Applications - Input field that allows users to include any desired applications into the report
Unique ID - Input field for a unique ID which is an alternate identification name for an application createad by the user.
Tag - Input field allowing users to include any desired created tags that have been associated to an application into the report.

Vulnerability Detail - Checkboxes divided into two categories, Severity and Other. The Severity options can be selected to include the desired vulnerability severity levels into the report, ranging from the most severe level of Critical down to the least severe level of Unassigned. The Other options provided vary from the following:
Total - Providing a total count of vulnerabilities
Old - Based on vulnerabilities identified and have remained open since the last scan
New - Based on vulnerabilities that have recently been identified in the most recent scan
Resurfaced - Based on vulnerabilities that were closed by have been reopened
Closed - Vulnerabilities that have been resolved and marked as closed
Hidden - Vulnerabilities that have been chosen to be hidden by the user. Note though hidden, these are still ingested unless they have been set to be excluded per-scanner.
Time - Users can select from available preset ranges of time such as Last Quarter, Last Year, or Forever. Also available is a calendar select input field allowing for a custom range of time to be set.